XFEL: Open Science COVID19 analysis platform online
Open Science COVID19 analysis platform online
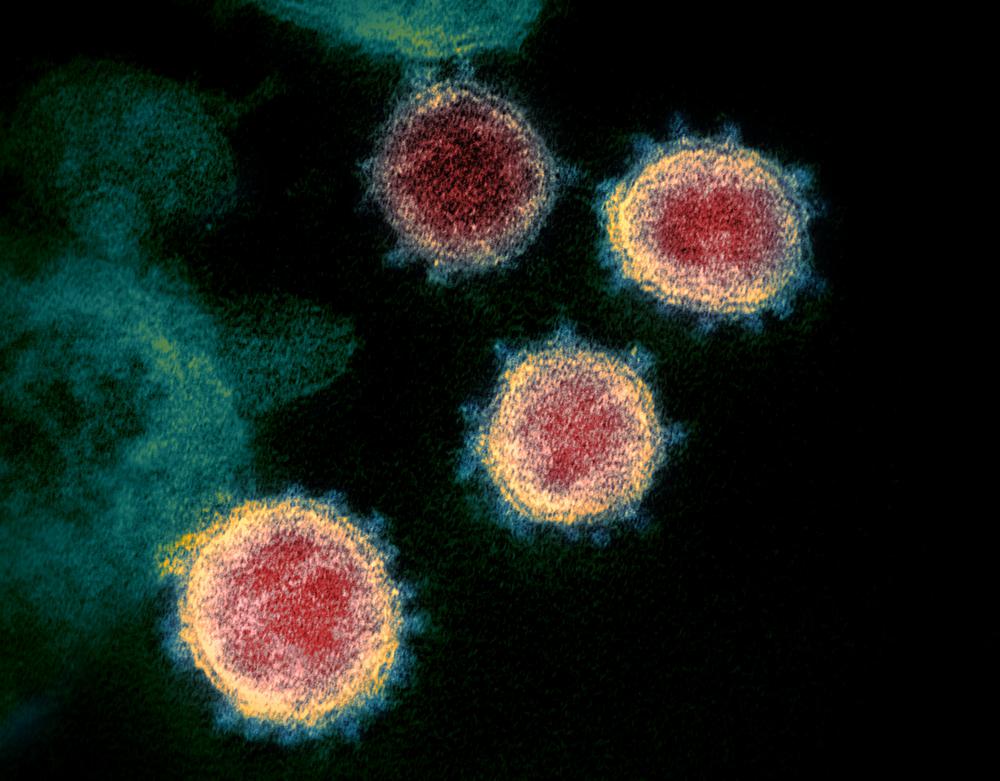
A transmission electron microscope image shows SARS-CoV-2—also known as 2019-nCoV, the virus that causes COVID-19—isolated from a patient in the U.S. Credit: National Institute of Allergies and Infectious Diseases (www.flickr.com/photos/niaid)
As part of the EU funded project PaNOSC, an international network of data scientists have developed the Open Science COVID Analysis (OSCOVIDA) platform to analyse the spread and development of COVID19 cases across the world. The interactive platform offers plots of COVID19 cases to better understand the development of the disease on different timeframes and geographical scales. The data is collected from a number of renowned national sources. Higher resolution data is also available from some regions such as for 412 districts in Germany and the individual states in the US.
“As societies we need to balance new infections and deaths with social distancing and containment measures. In the absence of a COVID19 vaccine, it is possible that this needs to continue for many years to come” says Prof Hans Fangohr, head of the data analysis group at European XFEL who leads the OSCOVIDA initiative. “We wanted to give more context to the figures we hear about in the news, such as how the number of new cases relate to those from the previous week, or what they can tell us about the spread of the disease. OSCOVIDA provides a tool that can help to assess the effectiveness of containment measures, and can help to understand the size and dynamics of new, hopefully fewer and more localised, COVID19 outbreaks. We want to enable the interested citizen to inspect and understand the data to a level that as barely possible with the reports in the media.”
In addition to viewing ready-made time series analyses of infections and deaths, citizens and scientists can re-execute the code that produces the plots, and modify the analysis interactively from their web browser. With some technical knowhow, the code can be re-used to build new tools for other purposes. The site uses technology, such as Project Jupyter, that is exploited within the PaNOSC project for the analysis of photon and neutron data, and used here in the context of the COVID-19 pandemic. The data sets are updated daily.
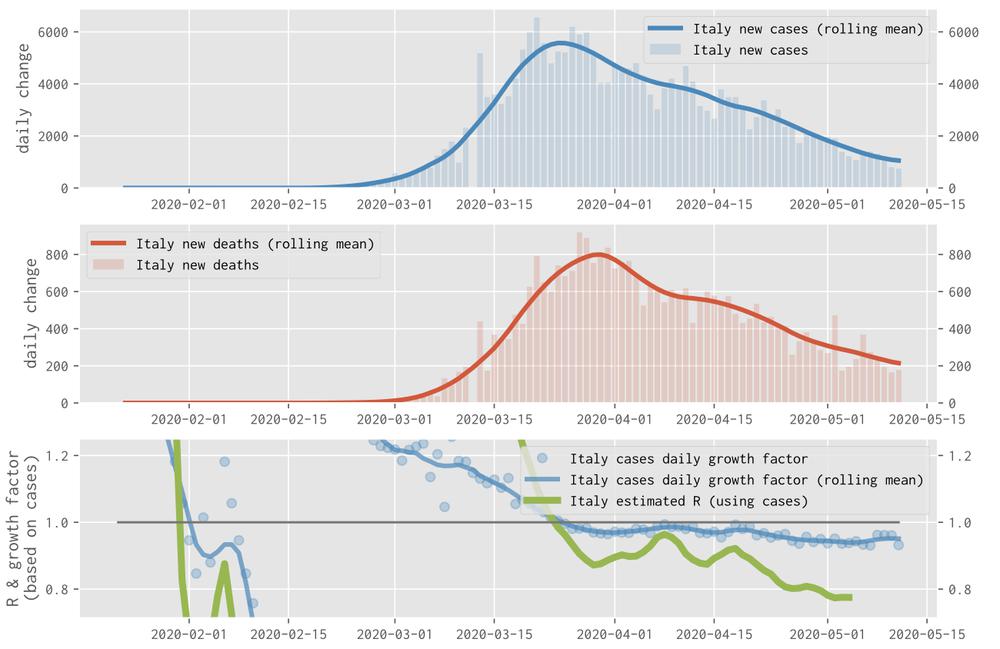
An example of a plot generated with the OSCOVIDA platform showing daily changes in cases in Italy between February and May 2020. Credit: PaNOSC
“The platform is based on the same open source software tools being used and provided by PaNOSC for doing photon and neutron science. All software and data is available and accessible online” says Andy Goetz, leader of the PaNOSC project. “This citizen science project is an example for the power of open source software: the results are fully transparent and anybody interested can study, verify, re-use and extend them. These are key features of open science, which help us to make scientific research more effective for society.”
The OSCOVIDA platform can be found here: http://oscovida.github.io
See also:
The PaNOSC webpage: https://www.panosc.eu
PaNOSC press release about OSCOVIDA: https://www.panosc.eu/news/panosc-open-science-covid-analysis-platform/
